9. Motion and Time

Text Book Exercises
Section outline
-
-
Q1. Classify the following as motion along a straight line, circular or oscillatory motion:
Ans:
(i) Motion of your hands while running. - Oscillatory motion
(The hands move to & fro & this motion is repeated)
(ii) Motion of a horse pulling a cart on a straight road. - Straight Line Motion
(The horse cart is moving along a straight path.)
(iii) Motion of a child in a merry-go-round. - Circular Motion
(iv) Motion of a child on a see-saw. - Oscillatory Motion
(The child moves up and down in a periodic manner.)
(v) Motion of the hammer of an electric bell. - Oscillatory Motion
(The hammer moves back and forth rapidly.)
(vi) Motion of a train on a straight bridge. - Straight Line Motion
(The train moves along a straight track.)
Q2. Which of the following are not correct?
Ans:
(i) The basic unit of time is second. - Correct
(ii) Every object moves with a constant speed. - Not Correct
(Objects can move at varying speeds.)
(iii) Distances between two cities are measured in kilometers. - Correct
(iv) The time period of a given pendulum is constant. - Not Correct
(Time period depends on the length of the pendulum)
(v) The speed of a train is expressed in m/h. - Not Correct
(The speed of a train is usually expressed in km/h or m/s)
Q3. A simple pendulum takes 32 s to complete 20 oscillations. What is the time period of the pendulum?
Ans:
Number of oscillations = 20
Total Time for 20 oscillations: 32 seconds
Time period = Total time / Number of oscillations
= 32 / 20 = 1.6 s.
The time period of the pendulum is 1.6 seconds.
To Remember:
Time Period = Total Time / Number of Oscillations.
Q4. The distance between two stations is 240 km. A train takes 4 hours to cover this distance. Calculate the speed of the train.
Ans:
Distance = 240 km
Time Taken = 4 hours
Speed = Distance / Time
= 240 km / 4 h = 60 km/h.
The speed of the train is 60 km/h.
To Remember:
Speed = Distance / Time
Q5. The odometer of a car reads 57321.0 km when the clock shows the time 08:30 AM. What is the distance moved by the car, if at 08:50 AM, the odometer reading has changed to 57336.0 km? Calculate the speed of the car in km/min during this time. Express the speed in km/h also.
Ans:
Initial odometer reading = 57321.0 km.
Final rdometer reading = 57336.0 km.
Distance covered = 57336.0 km - 57321.0 km
= 15 km.
Time Taken = 20 minutes (from 08:30 AM to 08:50 AM).
Speed = Distance / Time
= 15 km / 20 min = 0.75 km/min.
To convert to km/h = 0.75 km/min × 60
= 45 km/h.
Speed of the car is 45 km/h.
Q6. Salma takes 15 minutes from her house to reach her school on a bicycle. If the bicycle has a speed of 2 m/s, calculate the distance between her house and the school.
Ans:
Time taken = 15 minutes
= 15 × 60 = 900 seconds
Speed of bicycle = 2 m/s
Distance = Speed × Time
= 2 m/s × 900 s = 1800 m.
The distance between Salma's house & school is 1800 meters or 1.8 km.
To remember:
Distance = Speed × Time
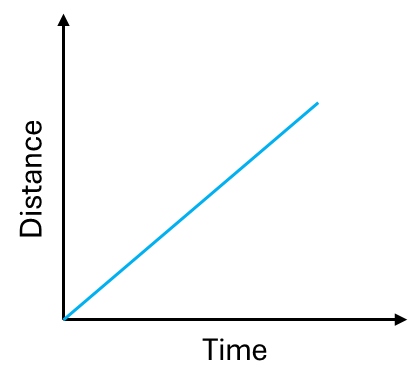
Q7. Show the shape of the distance-time graph for the motion in the following cases:
Ans:
(i) A car moving with a constant speed - (The car is in uniform motion.)
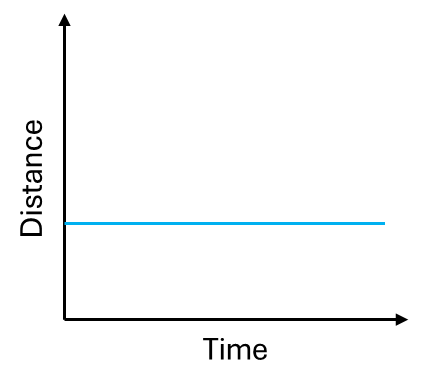
(ii) A car parked on a side road. - (A horizontal line as no distance is covered)
Q8. Which of the following relations is correct?
Ans:
(ii) Speed = Distance / Time
Q9. The basic unit of speed is:
Ans:
(iv) m/s
Q10. A car moves with a speed of 40 km/h for 15 minutes and then with a speed of 60 km/h for the next 15 minutes. The total distance covered by the car is:
Ans:
(ii) 25 km
Explanation:
When the speed of the car is 40 km/h:
Time = 15 min
= 15 / 60 =0.25 hr
Distance = speed x time
= 40 x 0.25 = 10 km
Similarly, when speed is 60 km/hr:
Time = 0.25hr
Distance = 60 x 0.25 = 15km
Total distance = 10 + 15 = 25 km
Q11. Suppose the two photographs, shown in Fig. 9.1 and Fig. 9.2, had been taken at an interval of 10 seconds. If a distance of 100 metres is shown by 1 cm in these photographs, calculate the speed of the fastest car.
Ans:
The distance covered by blue car = 1cm
Distance = 1 x 100 = 100m
Time = 10s
Speed = Distance / Time
= 100 / 10 = 10 m/s
The speed of blue car is 10 m/s.
Q12. Fig. 9.15 shows the distance-time graph for the motion of two vehicles A and B. Which one of them is moving faster?
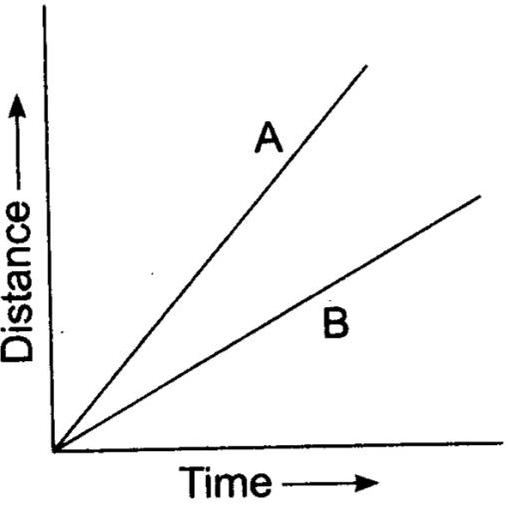
Fig. 9.15 Distance-time graph for the motion of two carsAns:
Car A is moving faster than car B.
Q13. Which of the following distance-time graphs shows a truck moving with speed which is not constant?
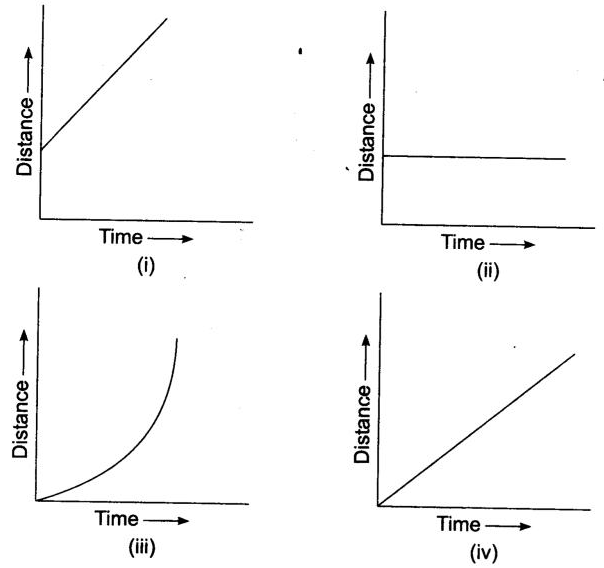
Ans:
(iii) - (the graph shows that the truck is moving with variable speed)
-